
Maximum likelihood estimation (MLE)
Say you have some data. Say you're willing to assume that the data comes from some distribution -- perhaps Gaussian. There are an infinite number of different Gaussians that the data could have come from: different means, different variances. MLE will pick the Gaussian that is "most consistent" with your data (the precise meaning of consistent is explained below).
So say you've got a data set of y = -1,3, and 7. The most consistent Gaussian from which that data could have come has a mean of 3 and a variance of 32/3. It could have been sampled from some other Gaussian. But one with a mean of 3 and variance of 16 is most consistent with the data in the following sense: the probability of getting the particular y values you observed is greater with this choice of mean and variance, than it is with any other choice.
Moving to regression: instead of the mean being a constant, the mean is a linear function of the data, as specified by the regression equation. So, say you've got data like x = 2,4,10 along with y from before. The mean of that Gaussian is now the fitted regression model X′β^
, where β^=[−1.9,.9]
[remove?]
Moving to GLMs: replace Gaussian with some other distribution (from the exponential family). The mean is now a linear function of the data, as specified by the regression equation, transformed by the link function. So, it's g(X′β)
, where 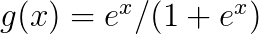 for logit (with binomial data).
for logit (with binomial data).Reference: http://times.cs.uiuc.edu/course/410/note/mle.pdf